Reading results
Audience: All users
Goal: Interpret analysis output—narrative, charts, tables, and downloadable artifacts.
Results layout
When a query completes, results appear in the session thread above the composer. PrismBI prioritizes analysis-first content:
- Analysis summary — plain-language narrative of findings
- Charts — bar, line, or comparison visualizations when applicable
- Tables — supporting row data (expand Supporting data under charts)
- Deliverables — intentional downloads (HTML reports, exports, images) when produced
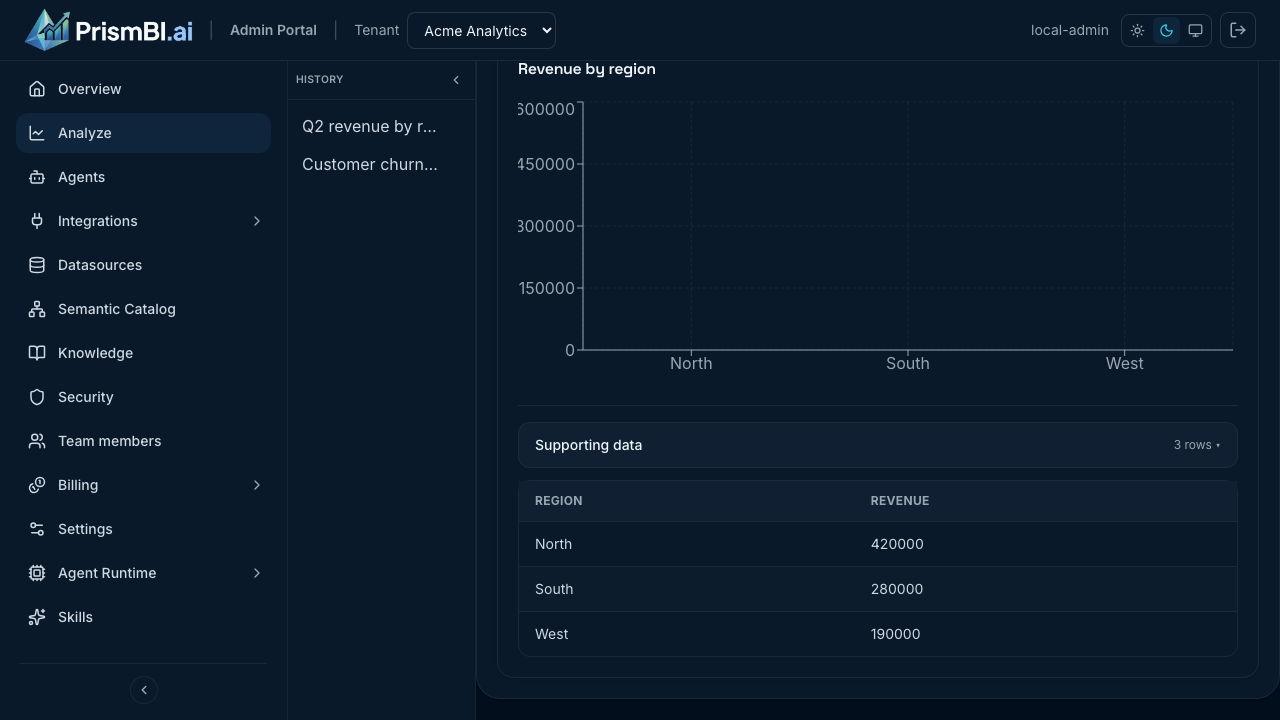
Figure: Analysis summary, chart, and supporting data.
Analysis summary
The summary is the primary narrative. It highlights trends, comparisons, and caveats in business language. Raw SQL and internal agent markdown are not shown in user mode.
Charts and tables
Charts inherit row data from query results. Use the collapsible Supporting data section under a chart to verify underlying numbers.
If a chart appears empty, check that the table block contains rows—the portal merges table data into chart blocks automatically.
Deliverables and export
- Deliverables panel — appears when the analysis produces intentional files (reports, CSV exports from tools, images). Auto-generated row CSV dumps are filtered out by default.
- PDF export — use the PDF action on a completed result when your tenant enables it, to share a snapshot outside the portal.
Tips
- Read the summary first, then validate with the table.
- Expand supporting data before presenting numbers to stakeholders.
- Suggested follow-up prompts may appear after completion—use them as starting points, not mandatory next steps.
Troubleshooting
| Issue | What to try |
|---|---|
| Chart missing | Rephrase to request a breakdown; confirm the query returned rows |
| Numbers look wrong | Check datasource, date filters, and row limit in Options |
| No deliverables | Not every query produces files; request a report explicitly in your prompt |